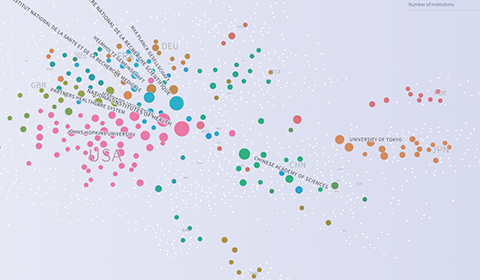
About This web application visualizes how successful universities or research-focused institutions collaborate. The application is based on papers (articles, reviews and conference papers) published between 2012 and 2016 in several subject areas and in “All areas”. For each subject area (and for “All areas”), those institutions (universities and research-focused institutions worldwide) were selected in the SCImago Institutions Ranking which published at least 500 papers in the publication period. We refer to these institutions as "reference institutions". For every reference institution, the collaborating institutions were identified. Collaborating institutions are those which have co-authored at least ten publications with the respective reference institution. We refer to the collaborating institutions as “network institutions”. We estimated statistical models (Bayesian multilevel logistic regressions). The statistically estimated best paper rates (from the models) which the reference institutions have achieved with its network institutions are visualized. The best paper rate gives the proportion of highly cited papers from an institution and is considered generally as a robust indicator for measuring citation impact. Co-authorship networks (based on institutional affiliations) show how successfully overall an institution (reference institution) has collaborated compared to all the other institutions, and with which other institutions (network institutions) an institution has collaborated best.
A detailed description of the methods as well the functionality of the application is available in our publication "Excellence networks in science: A Web-based application based on Bayesian multilevel logistic regression (BMLR) for the identification of institutions collaborating successfully" (arxiv, ScienceDirect).
Definitions
Reference institution: A reference institution provides for the ego in the egocentric network. The institution has published at least 500 papers between 2012 and 2016 in a certain subject area or in “All areas” (and is also included in our web application excellencemapping.net for these publication years). For a reference institution, the network of collaborating institutions can be visualized. For the networks in “All areas”, we additionally restricted the number of included institutions to 522; otherwise, the statistical model had not performed. These institutions belong to the best institutions worldwide in terms of best paper rate or number of co-authored papers, respectively.
Network institution: Network institutions appear as collaborating institutions of reference institutions, but their own network of collaborating institutions cannot be shown. Only collaborating institutions with at least ten joint papers with the reference institution are considered.
Best paper rate: The best paper rate is the proportion of papers which belong to the 10% most cited papers in the corresponding subject areas and publication years (statistically estimated probability). The application only presents best paper rates of papers published by authors from more than one institution. As the citation impact of papers published in collaboration is commonly higher than the impact of papers published without collaboration, the best paper rates reported in the web application are particularly high.
See also
our related web application excellencemapping.net which visualizes scientific excellence worldwide in several subject areas and in "All areas". For example, for each institution (university or research-focused institution), the estimated probability of publishing highly cited papers (best paper rate) is shown. The probability can be adjusted by covariates (e.g. the corruption perception index of the countries in which the institutions are located).
Created by
Lutz Bornmann, Division for Science and Innovation Studies, Administrative Headquarters of the Max Planck Society, Hofgartenstr. 8, 80539 Munich, Germany,
Rüdiger Mutz, Center for Higher Education and Science Studies, CHESS, University of Zurich, Andreasstrasse 15, 8050 Zurich, Switzerland
Moritz Stefaner, Truth & Beauty Operator, and
Felix de Moya Anegón, CSIC/CCHS/IPP, SCImago Group (Spain), Communication and Information Science Faculty, University of Granada, Granada, Spain
Contact us at info@excellence-networks.net. We are looking forward to your questions, comments and feedback.